Skip to content
GetProfit
Demo

Platform · Assortment and seasonality

How much of the catalogue reached sales — and what the rest is doing

The portal walks the whole catalogue through the stages — from the feed to sales, shows where the budget goes by product group, and answers whether you really have a season.

  • In the catalogue 5 819
  • Eligible for ads 5 602
  • Showing in ads 2 501
  • Spending budget 745
  • Bringing conversions 40
  • Paying off at target efficiency 38

One shop's catalogue in the portal: how many items reached each stage. Impressions, spend and sales — over 90 days.

Catalogue in ads

A product can be ready for ads and never show once

The portal also counts as ready for ads those products held back by one thing only: nobody added them to a campaign. So the gap between two neighbouring stages is not rejected products and not a broken feed — it is a healthy catalogue that never made it to impressions.

Eligible for ads

5 602

Showing

2 501

Never shown once

3 101

This covers both the products that are in no campaign at all and those that are in one but never got any impressions. The portal keeps these two reasons apart.

The figures come from the section's screen in the portal, a 90-day impression window.

It isn't only a single product that goes without impressions. Sometimes it's a whole category

The portal separately collects the categories where nine out of ten ads-ready products got not a single impression over 90 days, and says it plainly: the feed there is fine, these products simply aren't added to campaigns. You won't find a category like that in Google's reports: only what was shown gets into them.

The budget is always spread unevenly. The question is whether it is deserved

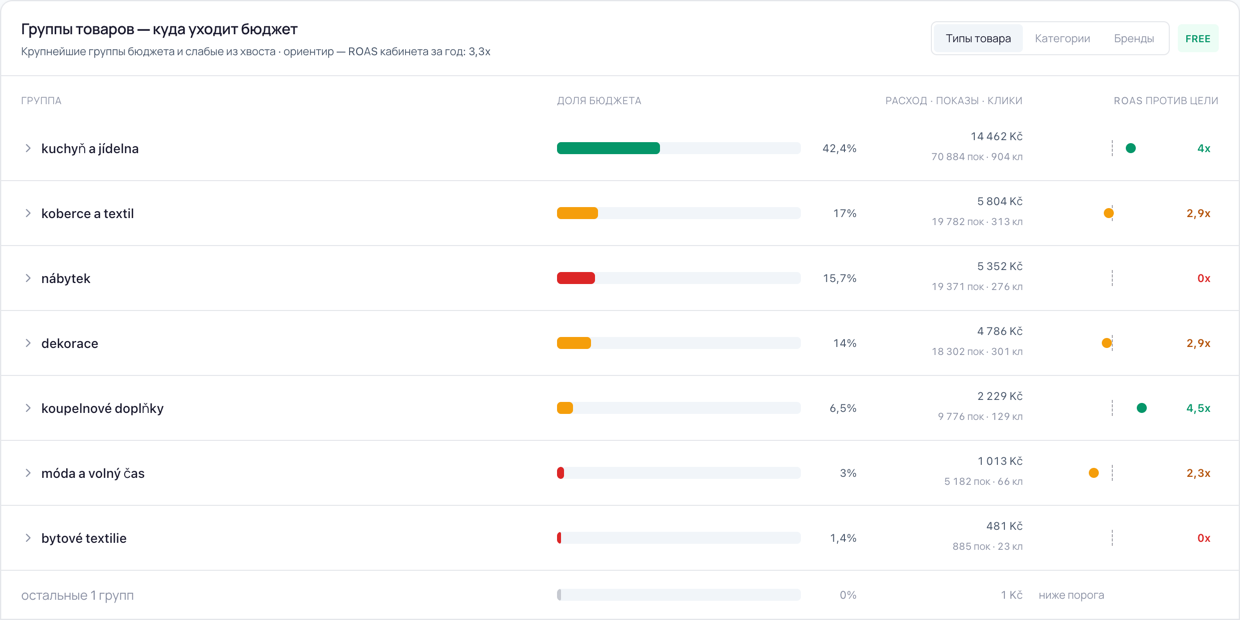
The portal lines up the biggest groups by budget share — you can look by product type, category or brand. Next to each stands its payback against a benchmark: your own goal if you set one, otherwise the ad account's average payback over the year. On this screen 15.7% of the budget goes to a group that returned nothing.

Product groups: budget share, spend, impressions and clicks, return against the benchmark
Product groups: budget share, spend, impressions and clicks, return against the benchmark Enlarge →

The portal names the notable groups one by one — and says what to do with each

The portal sorts the notable groups into four lists and names every one of them. The wording below is the same as on screen. Groups with nothing to conclude stay as just a row in the table.

  • Working well

    Keep, protect and grow.

  • Expand

    They pay off above the goal but get little budget — candidates for growth.

  • Limit and repurpose

    Spend is there, return is low: cut budgets here and move them to what works.

  • Give a test

    Too little data, too early to judge.

The portal takes these same conclusions into account when it builds the recommended campaign structure.

Revenue is up — the portal says whether that is demand or just added budget

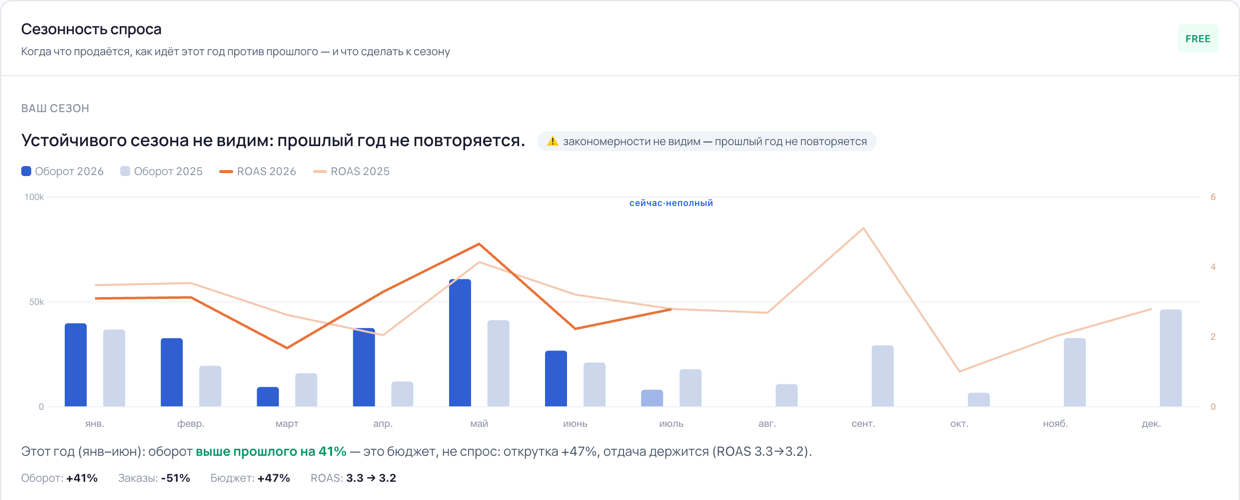
Revenue by month over two years, with the payback line on top. When the year runs above the previous one, the portal checks where the growth came from: demand rose, or budget was simply added. On this screen revenue is 41% higher and spend 47% higher, and the portal spells the conclusion out: it's budget, not demand.

Demand seasonality: revenue by month over two years, the return line and a verdict on the year
Demand seasonality: revenue by month over two years, the return line and a verdict on the year Enlarge →

Not every shop has a season — and the portal won't invent one

The portal takes 24 completed months — two full years that can be compared with each other. And it says honestly what came out of that comparison: one of five states.

  1. Confirmed by two years

    Both years gave the same profile. You can plan purchasing and budget around a season like that.

  2. The peak repeats, the baseline shifted between years

    The peak fell in the same window, the rest of the year looked different. We trust the peak; the baseline, with care.

  3. One year only — not confirmed yet

    There is no second year to compare with yet. The peak is visible, but whether it repeats is unknown.

  4. No pattern visible — last year doesn't repeat

    The two years look nothing alike. The portal builds no seasonal plan and says so.

  5. Too little data — analysis impossible

    There are too few conversions to tell a season from chance.

The portal assigns the same state to each notable category separately: a shop may have no season while a category inside it does.

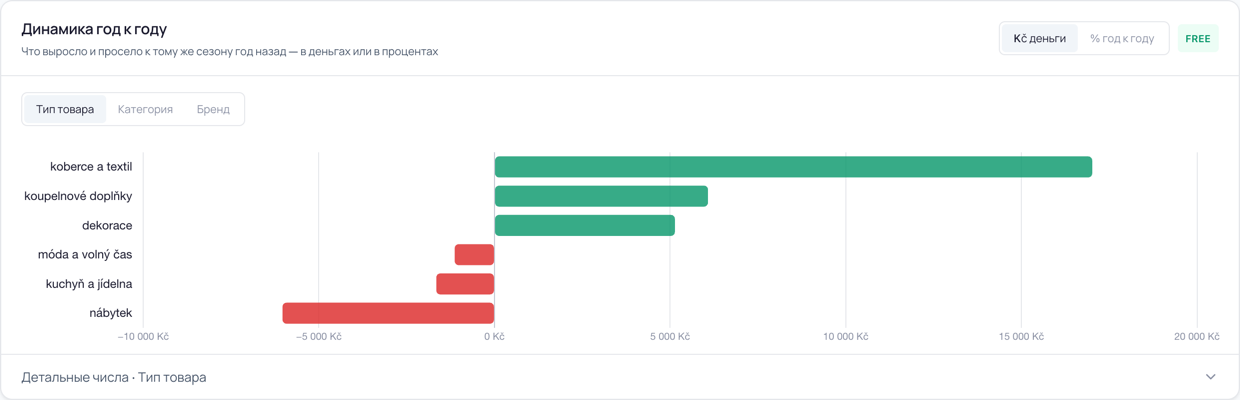
What grew and what dropped against the same season a year ago

The same 90 days, only a year ago — by product type, category or brand, in money or in percent. If there isn't enough history for last year's window, the chart isn't drawn at all: the portal will say there is nothing to compare with rather than show a picture built on holes.

Year over year: what gained and what lost in money against the same window a year ago
Year over year: what gained and what lost in money against the same window a year ago Enlarge →

What people usually run into

Three situations that most often send people to this section.

“Spend keeps growing, revenue stands still”

The budget went up, revenue stayed roughly the same. There are thousands of items in the catalogue, you can't review them by hand, and which part of the money works shows up in no report.

What the portal does

Shows what share of the budget goes to the biggest product groups and how each pays off against the benchmark. A big group with a weak return stands out at once.

“Half my catalogue I never see in ads at all”

The assortment grew for years, campaigns were put together along the way. Nobody checked which of the new items reached impressions and which were left behind.

What the portal does

Walks the whole catalogue through the stages from the feed to sales and separately names the categories where almost nothing is showing.

“We buy for the season from memory”

What to buy for November is decided from last year and from gut feel. And whether last year repeats — nobody checked.

What the portal does

Shows the demand profile by month over two years and says whether it holds. If there is no pattern — it will say so.

Access

Google Ads and Merchant Center. Sign in with Google in one click — we change nothing in the account without your consent

Plan

Assortment analysis — the Growth plan and above

Window

The catalogue is a snapshot of the feed as of today. Impressions, spend and sales — over 90 days. Seasonality — over two full years

Screens from an account in the portal.

Assortment answers which part of the catalogue works. The neighbouring sections answer why that is and what to do about it

The same data, only up close: the specific products, the reasons on the feed side and how the catalogue is spread across campaigns.

Common questions

Google Ads already has reports by category and brand. Why another one?

Google's reports are built on what was shown. A product that never made it into a campaign won't appear in them — as if it did not exist. The portal takes the catalogue as a whole and shows the part the ads never reached as well.

On the screen, less than a percent of the catalogue brings conversions. Isn't that a failure?

No, and the portal says so right on the screen: a narrow core is normal for a shop. What to look at is something else — the gap between the “Eligible for ads” and “Showing in ads” stages. That is where the catalogue you have already built up sits, and the ads make no use of it.

Are two years enough to talk about a season?

Enough for one thing: to check whether last year repeated. If it did, the season can be trusted and purchasing planned around it. If it didn't, the portal will say so rather than name you a season. The five states above are exactly about this.

How is this different from the “Products and labels” section?

By altitude. “Products” takes each item apart separately and gives lists of specific SKUs. “Assortment” looks at the catalogue as a whole: how much of it reaches sales, how the budget is spread across groups and how that changes with the seasons. The data is the same, the scale is different.
See which part of your catalogue works

Sign in with Google in one click. The portal changes nothing without your consent.

Break down your catalogue